
he Federal Reserve cut interest rates 25 basis points last week to a range of 4.00% to 4.25%. This was undoubtedly one of the most stressful meetings of Chairman Powell’s tenure. First, inflation has yet to become a persistent problem in the US economy. Headline inflation ticked up to from 2.7% to 2.9% in August, below its peak for this year and core inflation remained steady at 3.1%. The Fed’s prior reluctance to cut rates stemmed largely from inflationary fears. Second, President Trump has placedStephen Miran on the Federal Reserve board of directors. Miran has been a vocal critic of Powell and a consistent voice for an easier monetary policy. Finally, Fed Governor Lisa Cook is facing a Supreme Court case to allow President Trump to fire her from the Fed board.
Despite all the behind-the-scenes drama, the Fed was able to forge a consensus around a 25 basis point cut. Governor Miran voted for a 50 basis point cut, but he was unable to attract any other supporters. One reason for his lack of support might be the plan of many Fed governors to cut rates at both of its upcoming meetings. A 25 basis point cut at both the October and December meetings might be viewed a sufficient response to the current market conditions. However, a combined 75 basis point cut in rates remains below where investors are pricing future Fed Funds rates. Futures markets are priced for the Fed Funds rate to drop below 3% by next year.
All this leaves investors needing guidance on what to do with their portfolios. We will evaluate Fed policy and the risks that the current Fed is taking. We will also examine the opportunities presented by the current market and the risks associated with those opportunities.
Equity markets greeted the Fed’s easing move with a big cheer. However, the bond market seems less comfortable with the inflation outlook than the equity market. The 10-year treasury jumped to 4.13%; a more than 14 basis point jump for the week.
Inflation has surprised many economists by staying within the limits of 2024. The Trump administration has set off a global trade war and yet inflation, thus far, has remained within the bounds of reasonableness. The bond market’s sell off in the wake of lower Fed Funds may signal an end to this period of relative calm. The bond market is sending a signal that it is increasingly uncomfortable with the Fed’s willingness to see what happens with inflation.
The result of this policy debate depends upon where we end up. If inflation remains under control, then equity markets can continue to move higher albeit at a likely slower pace. On the other hand, an outbreak of inflation would terminate the equity market rally. Bonds will sell off and drag equity prices along with them.
There is little question that the S&P 500 is currently overvalued. At the end of August, the S&P 500 was trading at a Cyclically Adjusted Price Earnings (CAPE) of 38.9x. It has done nothing but go up after month end. This compares with an average CAPE for the S&P 500 of about 29x.
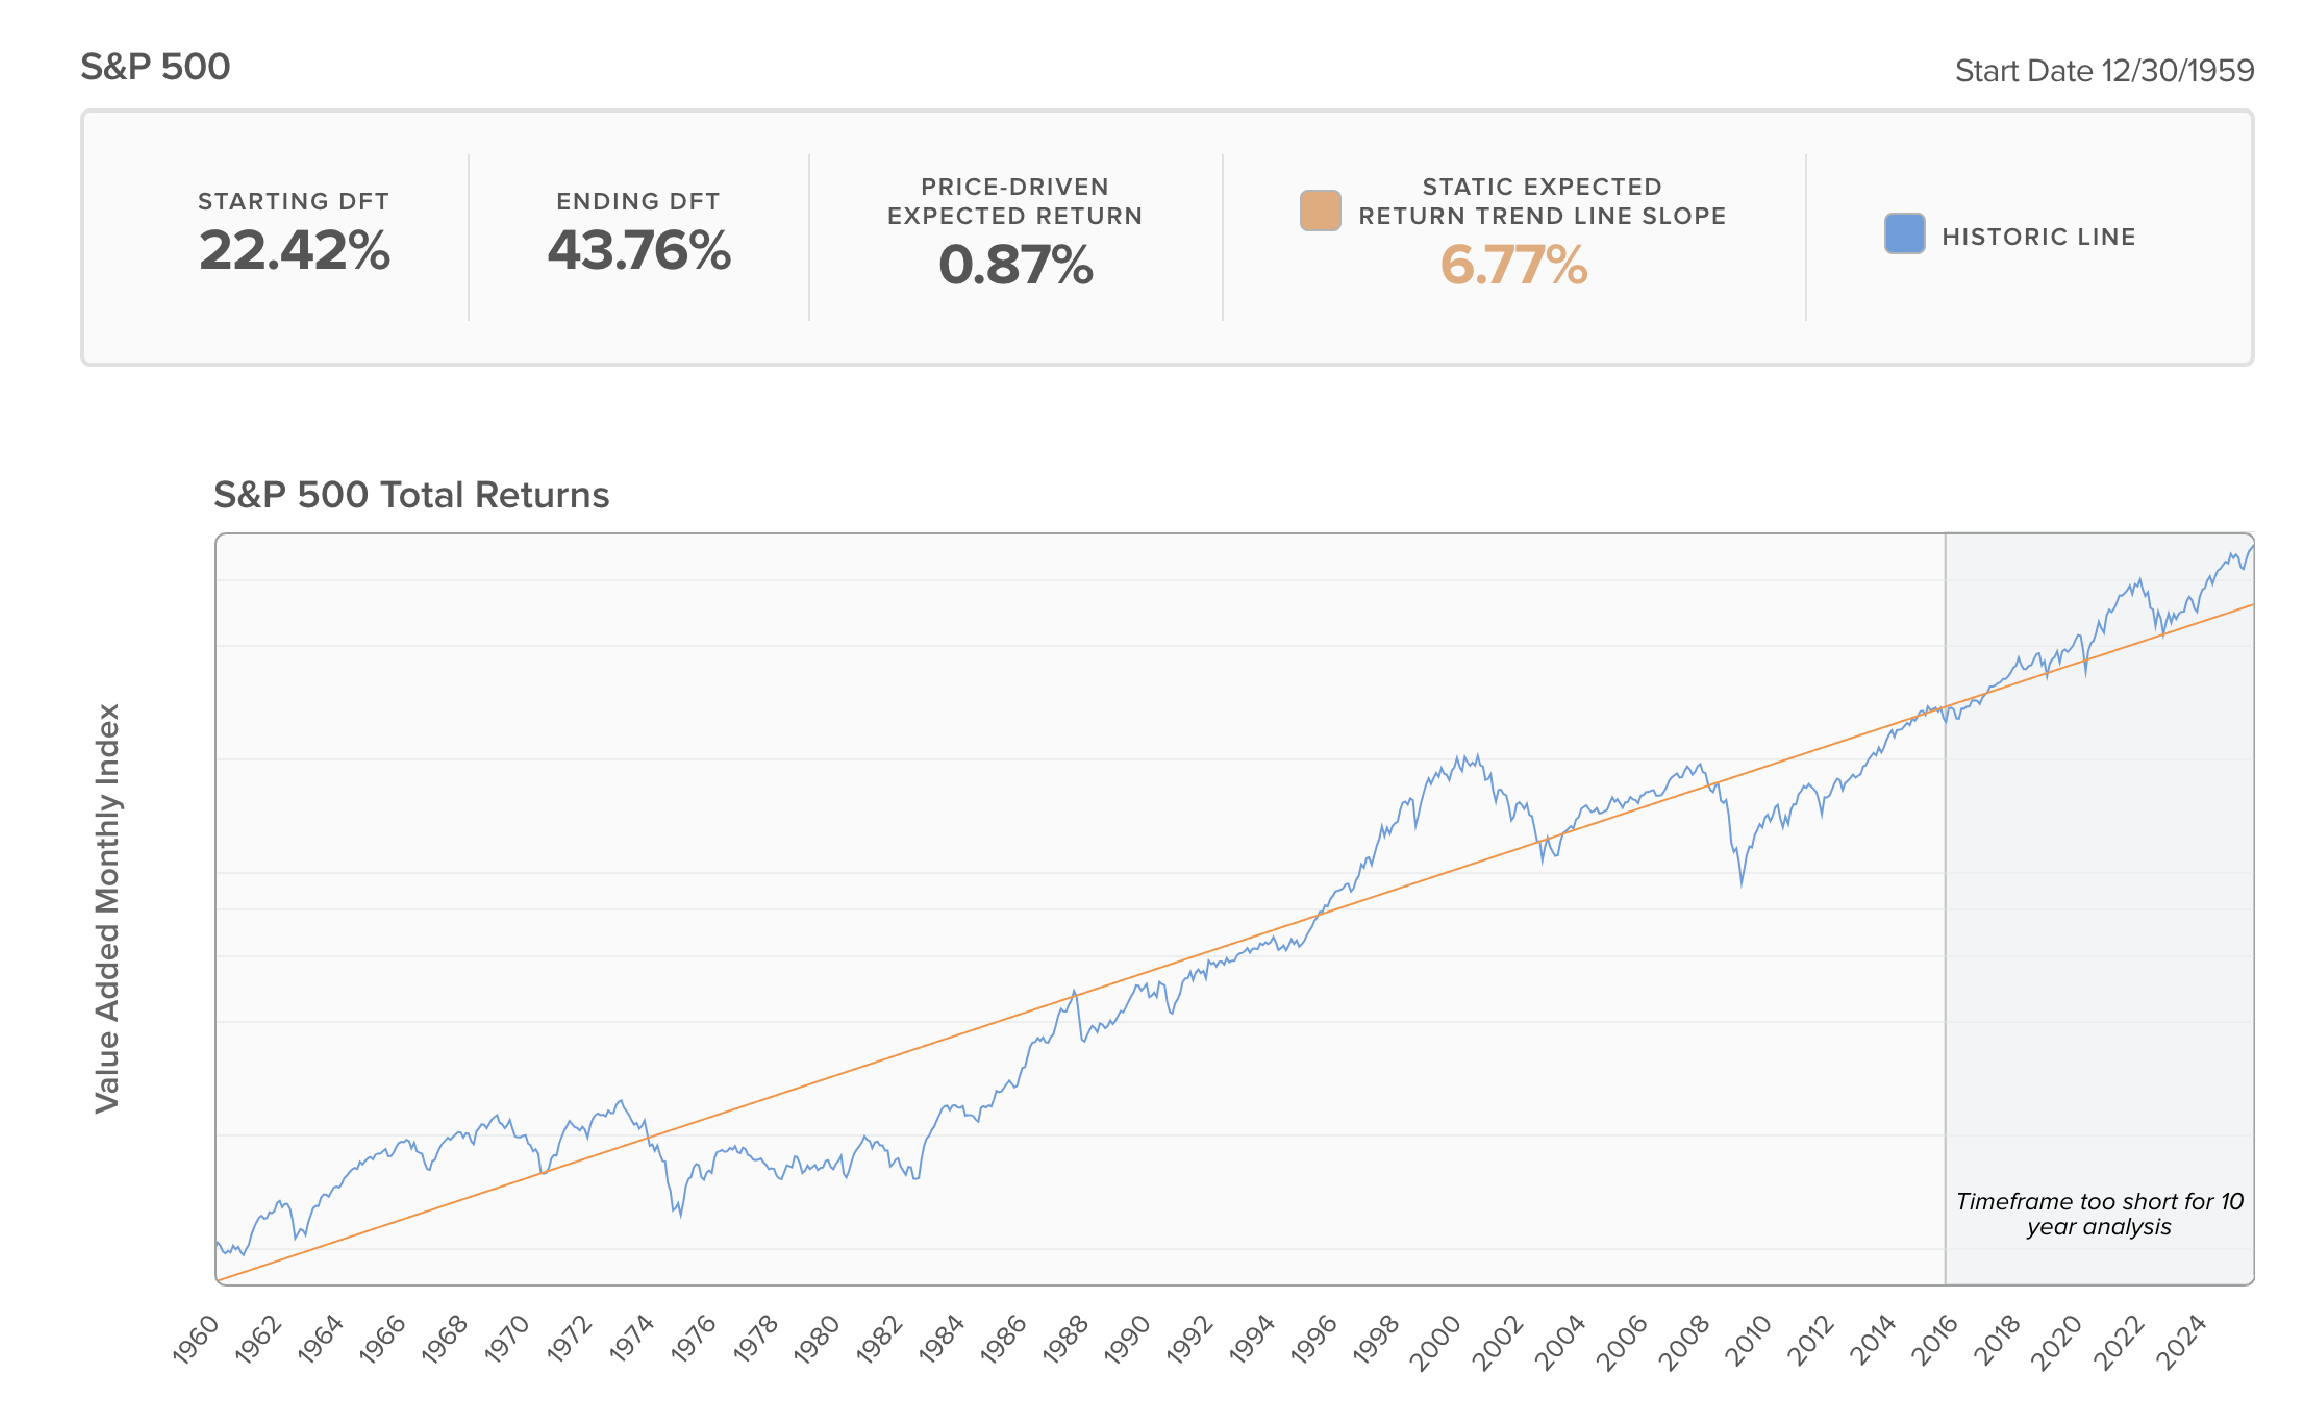
We use the index’s distance from its long-term trend returns to gauge the extent of over or undervaluation. Each asset class has a long-term rate of return that it has produced for many years. In the case of the S&P 500 that long-term return is 6.8%, plus the rate of inflation. As shown in the chart below, the S&P 500 has frequently returned more than this long-term equilibrium and it has frequently returned less. The best signal we have found to determine when the index is likely to perform well over the next 10 years is its distance from its long-term trend return. By this measure, the S&P 500 is about 45% overvalued. We are expecting a 90 basis point return over the next 10 years as compared with a 6.8% long term average for this index.
The S&P 500 Growth, S&P 500 Value and the S&P 500 Momentum are also overvalued (see table at end of article). Our distance from trend measure for the S&P 500 Growth projects a return of about -1.6% over the next 10-years, compared to its long-term return of 8.9%. S&P 500 Value is much less stressed than S&P 500 Growth, but its 2.1% expected return is well short of its long-term trend return of 6.5%. Momentum stocks have been a big part of the S&P 500 run up over the past 3 years. The S&P 500 Momentum index is forecast by our Price-Driven methodology to return 2.8% over the next 10 years, far short of its 10.4% long term performance.
Although many large cap stocks are overvalued, not all stocks carry a premium. Just changing the cap weighted S&P 500 to an equal weighted strategy boosts potential returns to 10.8%. This is because returns on the S&P 500 have been dominated by the 7 largest stocks in the index.
Dividend stocks as modeled by the S&P Dividend Aristocrats index have also largely been left out of the market rally. Their long-term trend returns are about 8.8%, but our Price-Driven model suggest returns of more than 10.0% over the next 10 years. Similarly, the S&P 500 Low Volatility index returns about 7.5% over the long run but buying at currently depressed prices indicate long term returns of 9.3%.
Midcap stocks are another place where current market prices indicate opportunity. Midcap stocks offer returns of as much as 9.9% compared to their long-term average of 8.7%.
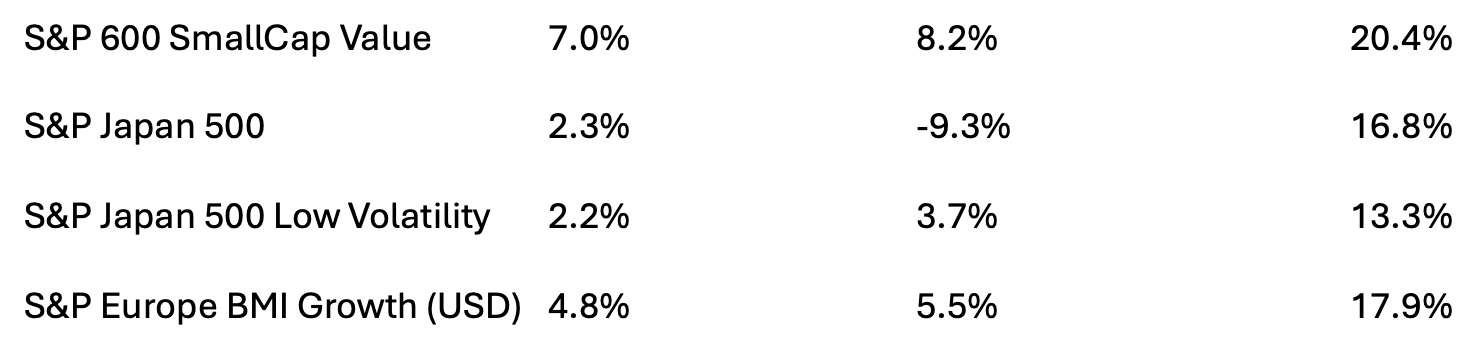
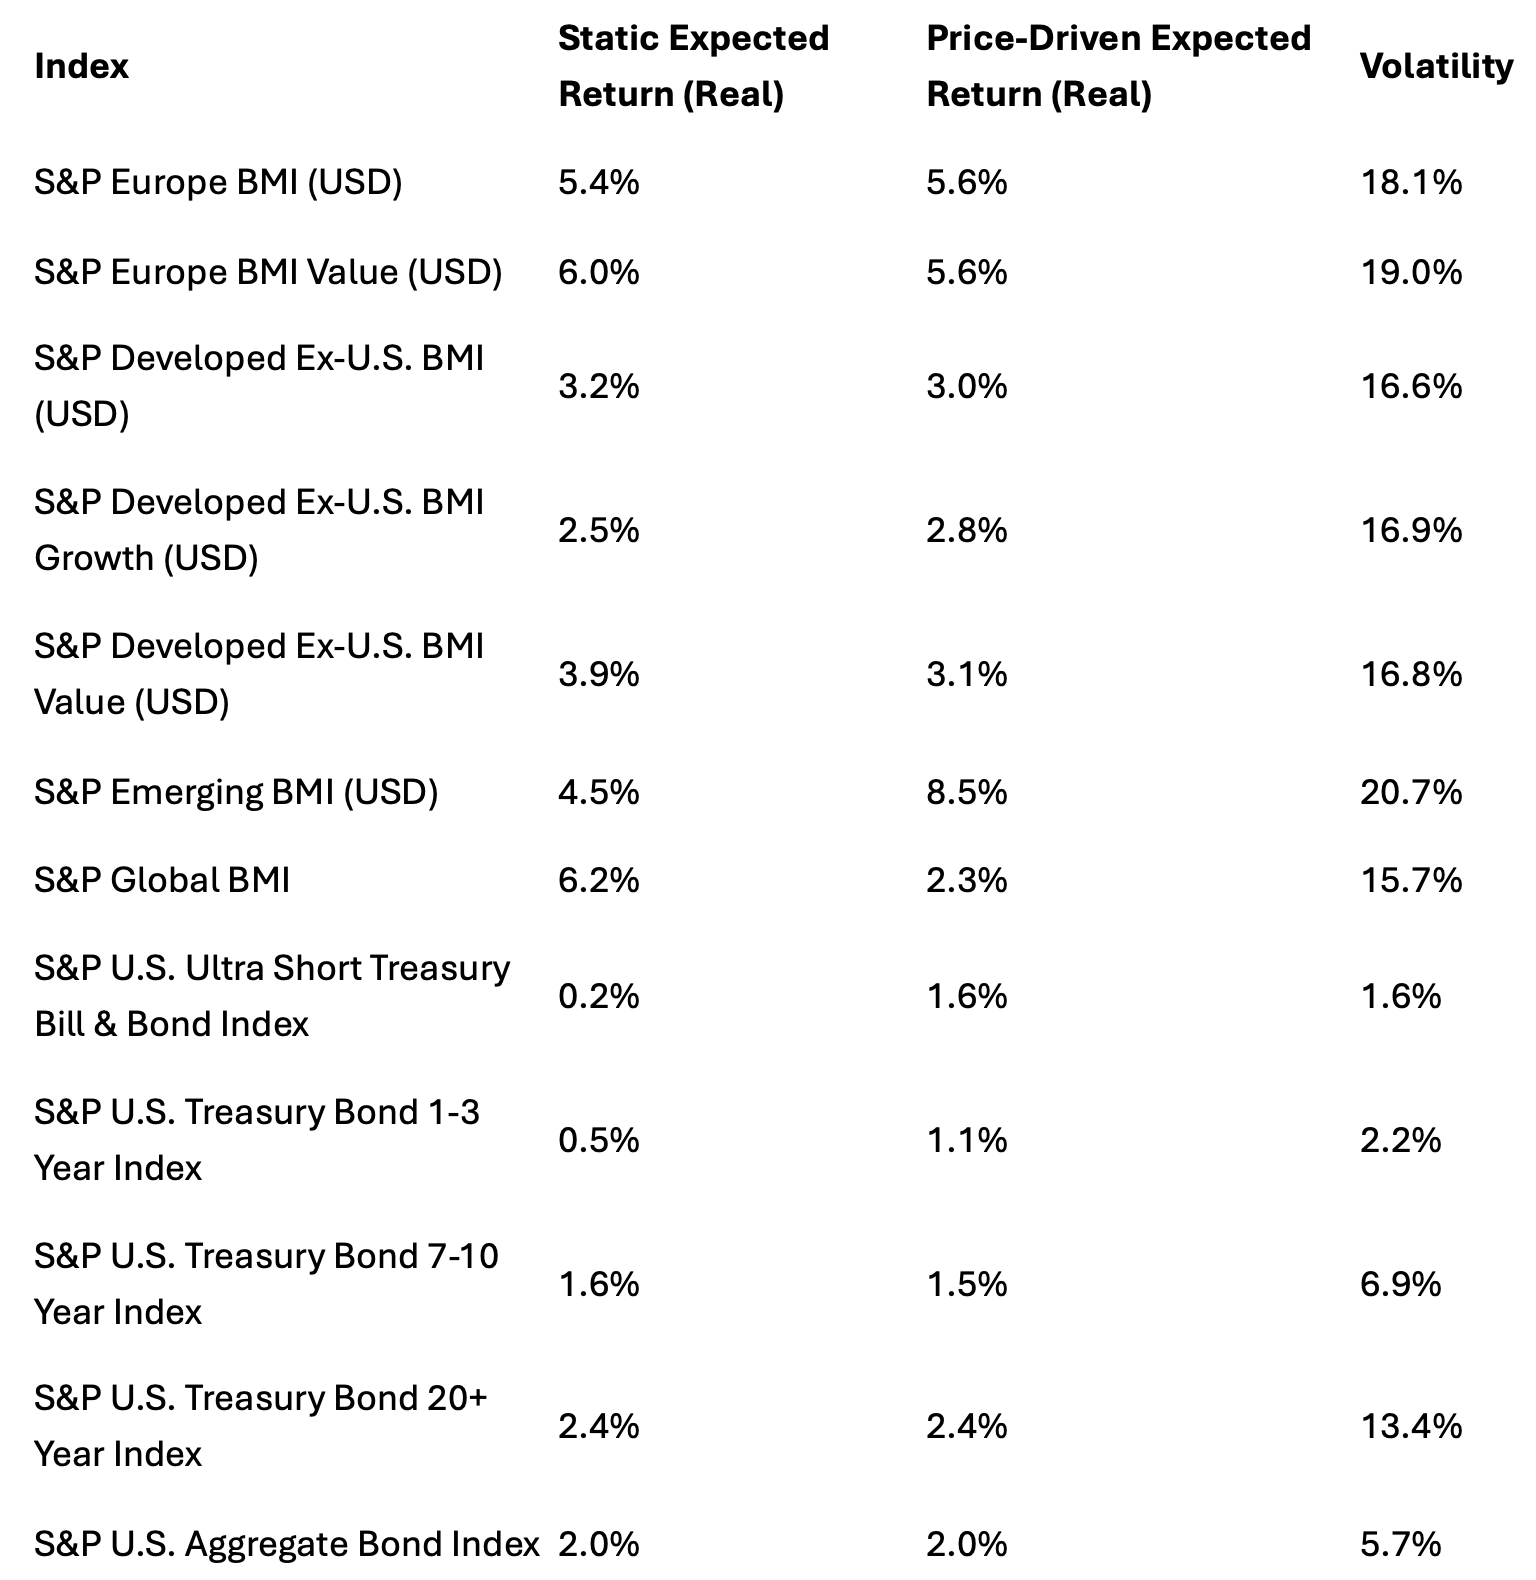
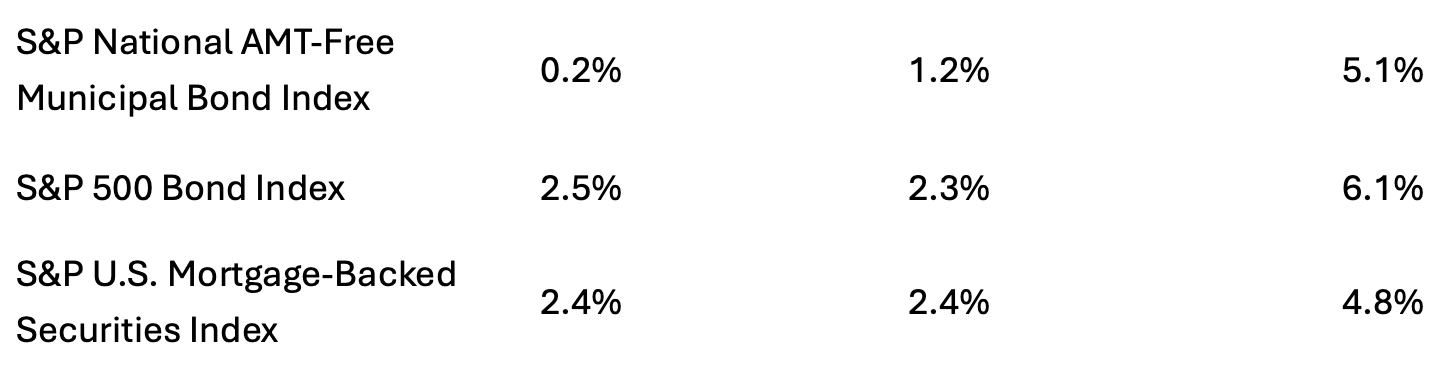
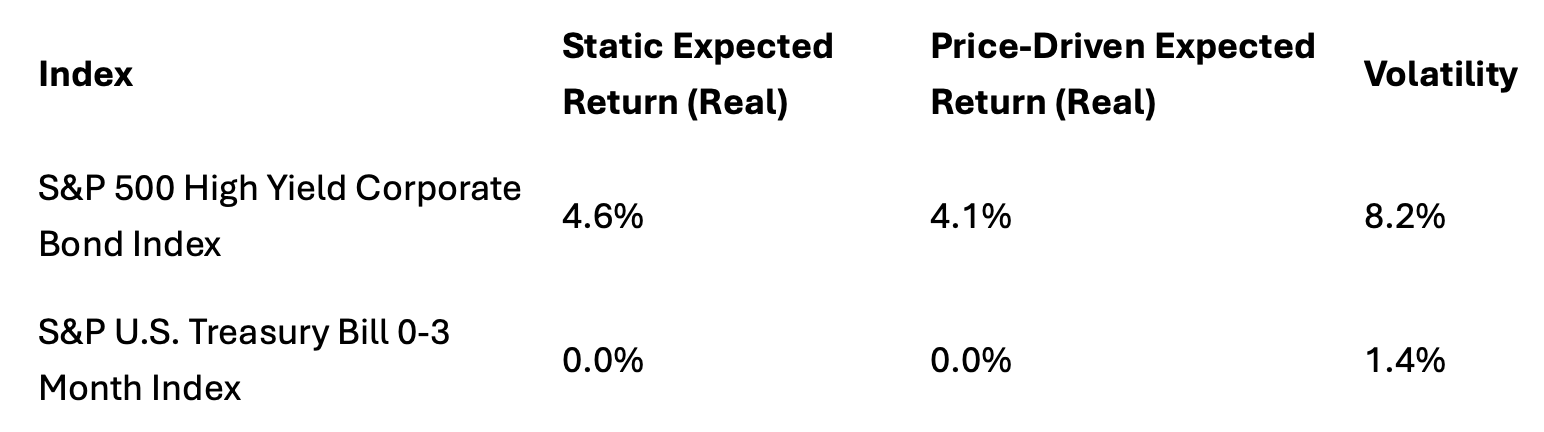
International stocks are closer to their long-term averages than US stocks, whether the US stocks are above or below fair value. None of the international stocks show a powerful undervaluation that would allow them to compete with Equal Weight, Dividend Aristocrats, Low Volatility or Midcap. Emerging markets are an exception, but the China domination of emerging markets keeps us on the sidelines for that asset class.
The Federal Reserve is under immense pressure from the White House to continue easing monetary policy. The market is torn about the implications of continued monetary easing with the equity market all for it and the bond market much more concerned. We believe that a best-case scenario for large cap stocks is a 4% to 5% return. Should the bond market collapse under the weight of escalating inflation, large cap stocks could lose 40% or more in a single year. Recovery of those losses would still leave investors with less than 1% returns over a 10-year period.
This combination of limited long-term upside for the S&P 500 and significant downside is our reason for derisking our portfolios. We have lowered equity weights and moved assets to Equal Weight, Dividend Aristocrats, Low Volatility and Midcap. This will remain our strategy until we gain better insights into the future path of equity markets.